


October 2018 was a difficult month for both managed futures and equities as concerns about valuations impacted equities, while trend corrections across a number of markets (including equities) generated difficult trading conditions for trendfollowing strategies. Historically, managed futures has performed well in equity bear markets, so the recent poor performance may prompt investors to question if managed futures can be a diversifying strategy going forward*.
Diversification or insurance
However, a low or zero long-term correlation does not mean that managed futures are a hedge or insurance for a long equity portfolio; returns will not always be positive when equities decline. The correlation over shorter time periods has fluctuated between negative and positive and looking back to 1987, the inception date of the Barclay CTA Index, managed futures and equities have suffered concurrent losses in about 18% of months. (Source: Bloomberg).*
*Past results are not indicative of future results.Unless otherwise stated, the Barclay CTA Index is used to represent the managed futures industry for the purposes of the linked paper. A description of the Barclay CTA Index is included below. CTAs may not generate positive performance in all market environments including equity bear markets. Trading in managed futures is not suitable for all investors given its speculative nature and the high level of risk involved including the risk of total loss of initial investment. Diversification does not assure profit, nor does it protect against a loss (including in a declining market).
Performance of the Barclay CTA Index in S&P 500 drawdowns: January 1987 to September 2018
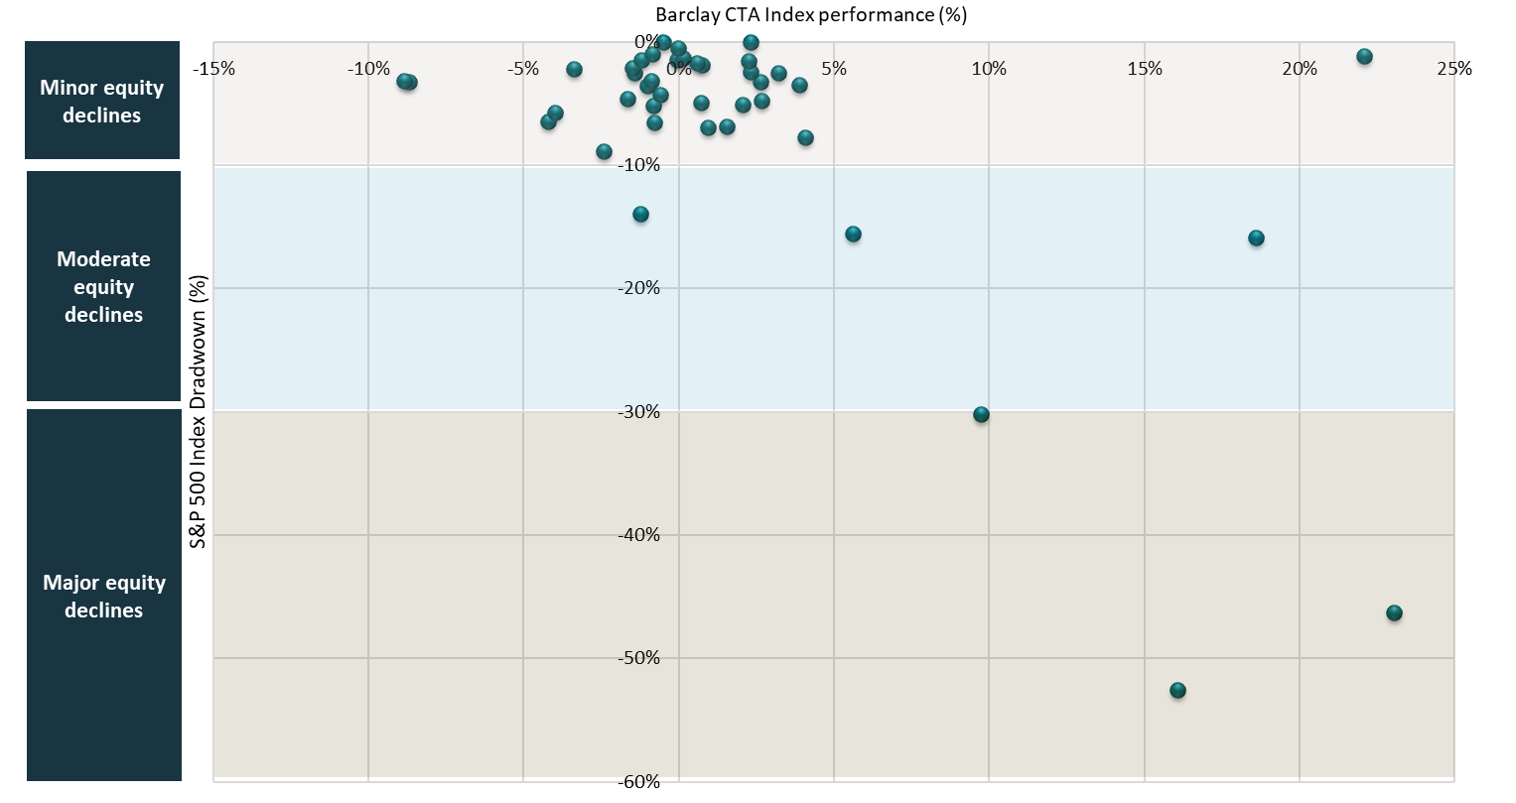
Source: Abbey Capital & Bloomberg. Barclay CTA Index is derived from data which is self-reported by investment managers based on the performance of privately managed funds. In contrast, the S&P 500 is an index comprising publicly traded shares. As a result, these indices may not be directly comparable and the above is shown for illustrative purposes only. An explanation of indices referenced can be found in the section headed ‘Indices’ below.
Looking at the scatter plot above gives further insight into how managed futures has historically performed when equities decline. The chart shows the performance of the Barclay CTA Index in each drawdown of the S&P 500 index since 1987[1]. As at the date of drafting, the return for October is not yet available for the Barclay CTA Index, so the data is shown as at September 30th 2018. We can see that managed futures has generated larger returns in the bigger drawdowns (“Major equity declines”) for the S&P 500 index. The two declines in excess of 10% but less than -20% (“Moderate declines”) were also quite positive, whereas S&P 500 index drawdowns which are less than 10% (“Minor declines”) have generated more mixed (although in aggregate positive) performance for managed futures.
One of the reasons for this is that equity bear markets have tended to be associated with strong trends not just in equities but in other markets. In contrast, when equities trend strongly to the upside and then correct (the Minor decline phase), it is typical for CTAs to suffer losses in equities. In those periods, performance will depend on the performance of non-trend strategies in equities and the performance of CTAs in non-equity markets. Put another way, equity declines in a bull market, or the initial stages of an equity bear market, tend to be much less favourable for managed futures than equity declines in an equity bear market. This year (2018) in both February and October equities corrected after being in an uptrend. In both months trend corrections in other markets accentuated the difficulties for trendfollowing strategies. In February crude oil fell -10%, in the early part of the month, correcting its uptrend, while in October 2018 WTI crude again dropped more than -10% and there were also notable corrections of trends in coffee, sugar and gold.
Have we seen similar periods in the past?
There is no doubt that the environment for managed futures has been difficult this year, and in recent years. The return for October is not yet available for the Barclay CTA Index; however, its year to date performance to 30 September 2018 is -1.6%*. To illustrate how managed futures performance was affected in October 2018, we instead look at the SG CTA Index, and see that this index is down -6.2% so far in 2018 (as at 31 October 2018), and based on daily data touched its largest ever drawdown since inception in 2000 during October*. However, taking a longer-term perspective and looking at the 5-year rolling Sharpe ratio of the Barclay CTA Index (which adjusts performance for the fact that rates were higher in the 1990s and early 2000s) we can see there have been similarly difficult periods for managed futures in the past, such as in the late 1990s/early 2000s.
*Source: Bloomberg. Past results are not indicative of future results. Trading in managed futures is not suitable for all investors given its speculative nature and the high level of risk involved including the risk of total loss of initial investment.
Barclay CTA Index rolling 5-year Sharpe ratio and Risk free rate: January 1987 to September 2018
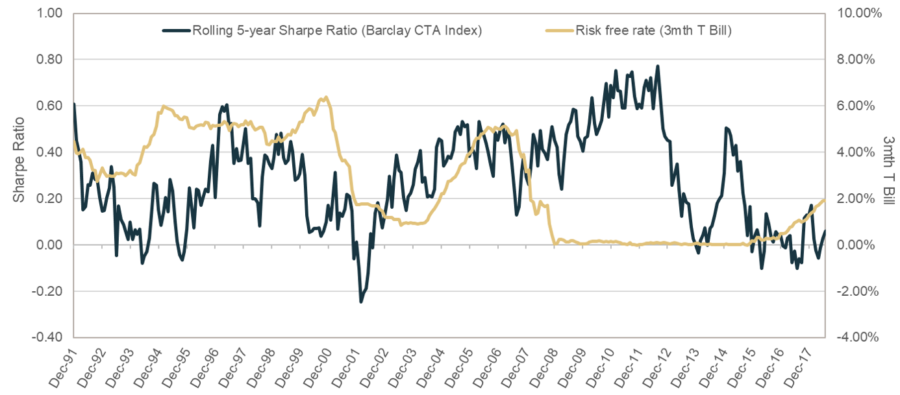
Source: Abbey Capital & Bloomberg. An explanation of indices referenced can be found in the section headed ‘Indices’ below.
Indeed, there may be parallels between 2018 and 2000: in both years equities corrected after a multi-year bull market. In 2000 CTAs struggled in the first nine months: the Barclay CTA Index was down -1.8% as of September that year, but the SG CTA Index and SG Trend Index were -7.3% and -16% respectively*. However, performance in the fourth quarter of 2000 and in 2001-2002 was positive even as equities continued to decline. Of course, it is impossible to predict whether equities will rebound from current levels or what trends will emerge in other markets, but the episode does highlight how the correlation between managed futures and equities can quickly change. A more difficult scenario for managed futures would be if markets continue to reverse or stay within ranges.
Conclusion
In tough periods of performance, such as the recent period, it is often difficult to maintain a long-term perspective on why an investor might allocate to managed futures. Notwithstanding the recent performance, it remains the case that over the long term, such as since inception of the Barclay CTA Index in 1987, managed futures has delivered positive performance with close to zero correlation to equities.
While recent performance has been disappointing the pattern of performance, with managed futures suffering losses in a moderate equity market decline is not unusual relative to history. Historically some of the best periods for managed futures have been in equity bear markets as opposed to equity corrections.
*Source: Bloomberg. Past results are not indicative of future results. Trading in managed futures is not suitable for all investors given its speculative nature and the high level of risk involved including the risk of total loss of initial investment.
Footnotes:
[1] Drawdowns based off monthly data as monthly data is only available for the Barclay CTA Index.
INDICES
S&P 500 Index
The S&P 500 Index is an index of 500 US stocks chosen for market size, liquidity and industry grouping, among other factors. The S&P 500 is designed to be a leading indicator of US equities and is meant to reflect the risk/return characteristics of the large cap universe.
SG CTA Index
The SG CTA Index is a daily performance benchmark of major CTAs; it calculates the daily rate of return for a pool of CTAs selected from the larger managers that are open to new investment. Selection of the pool of qualified CTAs used in construction of the Index is conducted annually.
SG Trend Index
The SG Trend Index is designed to track the 10 largest trend following CTAs (by AUM) and be representative of the trend followers in the managed futures space. The index is equally weighted and rebalanced annually on the 1st of January.
Barclay CTA Index
The Barclay CTA Index is a leading industry benchmark of representative performance of commodity trading advisors. There are currently 541 programs included in the calculation of the Barclay CTA Index. The index is equally weighted and rebalanced at the beginning of each year.
GLOSSARY DEFINITIONS
Sharpe ratio
The Sharpe ratio is a measure of risk-adjusted return. The measure subtracts the risk-free rate from the annualised performance of the asset or fund and divides by the realised annualised volatility. A higher (lower) Sharpe ratio is seen as indicative of stronger (weaker) risk-adjusted performance.
Correlation
Correlation is a statistical measure which quantifies the extent to which two assets, or securities, move in relation to each other. The correlation coefficient between two assets can vary from between -1 and +1, with a positive correlation indicating a tendency to rise and fall together, and a negative correlation indicating a tendency to move in opposite directions. In this document we measured the correlation between the monthly returns of the Barclay CTA Index and the S&P 500 Index, and found that the correlation, over the full time period (01- Jan-1987 to 30-Sep-2018), is -0.02. As this is close to zero it indicates that, over time, there is little relationship between monthly returns of the Barclay CTA Index and the monthly returns of the S&P 500 Index.
Important Information, Risk Factors & Disclosures
This document is for the purpose of providing general information and does not purport to be full or complete or to constitute advice.
Abbey Capital is a private company limited by shares incorporated in Ireland (registration number 327102). Abbey Capital is authorised and regulated by the Central Bank of Ireland as an Alternative Investment Fund Manager under Regulation 9 of the European Union (Alternative Investment Fund Managers) Regulations 2013 (“AIFMD”). Abbey Capital is registered as a Commodity Pool Operator and Commodity Trading Advisor with the U.S. Commodity Futures Trading Commission (“CFTC”) and is a member of the U.S. National Futures Association (“NFA”). Abbey Capital is also registered as an Investment Advisor with the Securities Exchange Commission (“SEC”) in the United States of America. Abbey Capital (US) LLC is a wholly owned subsidiary of Abbey Capital. None of the regulators listed herein endorse, indemnify or guarantee the member’s business practices, selling methods, the class or type of securities offered, or any specific security.
While Abbey Capital has taken reasonable care to ensure that the sources of information herein are reliable, Abbey Capital does not guarantee the accuracy or completeness of such data (and same may not be independently verified or audited) and accepts no liability for any inaccuracy or omission. Opinions, estimates, projections and information are current as on the date indicated on this document and are subject to change without notice. Abbey Capital undertakes no obligation to update such information as of a more recent date.
Pursuant to an exemption from the CFTC in connection with accounts of qualified eligible persons, this report is not required to be, and has not been, filed with the CFTC. The CFTC, the SEC, the Central Bank of Ireland or any other regulator have not passed upon the merits of participating in any trading programs or funds promoted by Abbey Capital, nor have they reviewed or passed on the adequacy or accuracy of this report.
Risk Factors: This brief statement cannot disclose all of the risks and other factors necessary to evaluate a participation in a fund managed by Abbey Capital. It does not take into account the investment objectives, financial position or particular needs of any particular investor. Trading in derinatives contracts is not suitable for all investors given its speculative nature and the high level of risk involved including the risk of loss. Prospective investors should take appropriate investment advice and inform themselves as to applicable legal requirements, exchange control regulations and taxes in the countries of their citizenship, residence or domicile. Investors must make their own investment decision, having reviewed the private placement memorandum carefully and consider whether trading is appropriate for them in light of their experience, specific investment objectives and financial position, and using such independent advisors as they believe necessary. The attention of prospective investors in the fund is drawn to the potential risks set out in the private placement memorandum of the fund under the heading ‘Risk Factors’.
Where an investment is denominated in a currency other than the investor’s currency, changes in the rates of exchange may have an adverse effect on the value, price of, or income derived from the investment. Past performance is not a guide to future performance. Income from investments may fluctuate. The price or value of the investments to which this report relates, either directly or indirectly, may fall or rise against the interest of investors and can result in a total loss of initial investment. Certain assumptions may have been made in this analysis, that have resulted in the returns detailed herein. No representation is made that any returns indicated herein will actually be achieved.
Potential investors are urged to consult with their own professional advisors with respect to legal, financial and taxation consequences of any specific investments they are considering in Abbey Capital products.
The information herein is not intended to and shall not in any way constitute an invitation to invest in any of the funds managed by Abbey Capital. Any offer, solicitation or subscription for interests in any of the funds managed by Abbey Capital shall only be made in a private offering to qualified investors pursuant to the terms of the relevant private placement memorandum and subscription agreement and no reliance shall be placed on the information contained herein.
This document and all of the information contained in it is proprietary information of Abbey Capital and intended solely for the use of the individual or entity to whom it is addressed or those who have accessed it on the Abbey Capital website. Under no circumstances may it be reproduced or disseminated in whole or in part without the prior written permission of Abbey Capital.
