Although commodity markets have generally been difficult for managed futures in 2019, precious metals have been something of a bright spot with some markets breaking out of multi-year ranges.
The move in gold, in particular, has provided a good opportunity for trendfollowing and momentum strategies. Although precious metals can sometimes trade off common factors, this year, diverse themes appear to be driving the markets.
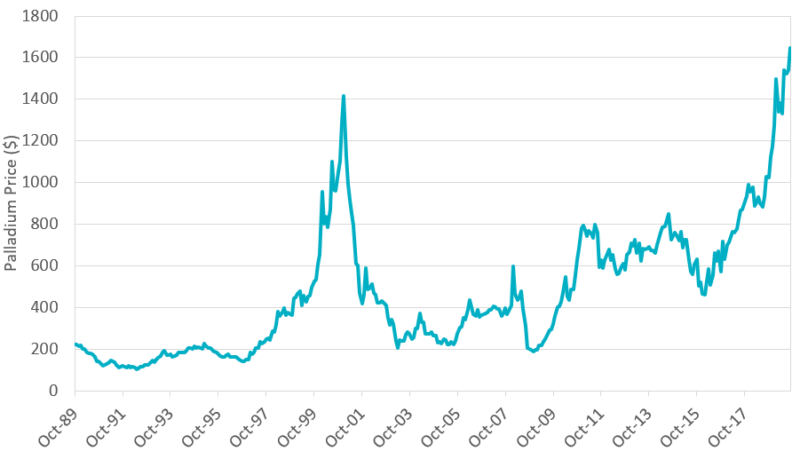
The strong rally in palladium has been the most notable move in precious metals in absolute terms in 2019. At the end of September 2019, palladium futures were up over +250% from its 2016 lows and over +40% in 2019. As Chart 1 shows, the strong rally in recent years followed a prolonged period when palladium traded in a $420-$850 range from 2010 to 2017.
It’s not unusual for markets to experience strong moves after a long period of ranging as investors sometimes anchor to the recent prices and then have to adjust to a shift in the supply-demand dynamic.
Chart 1. Palladium over 30 years, front month futures contract: Oct-1989 to Sep-2019
Source: Abbey Capital & Bloomberg. The front month futures contract refers to the contract which is the nearest to expiry at any point in time. Past results are not indicative of future returns.
In recent years there has been a fundamental shift in the supply-demand equation in palladium as supply has been constrained but demand has grown strongly amid strong demand for palladium for catalytic converters given tightening emission standards for automobiles.
Notably, futures markets have moved into backwardation** with near-month futures trading at a premium, often a sign of a market experiencing a shortage. However, liquidity in palladium futures is not as deep as in other precious metals and typically gold and silver will be more significant return drivers for many managers in managed futures.
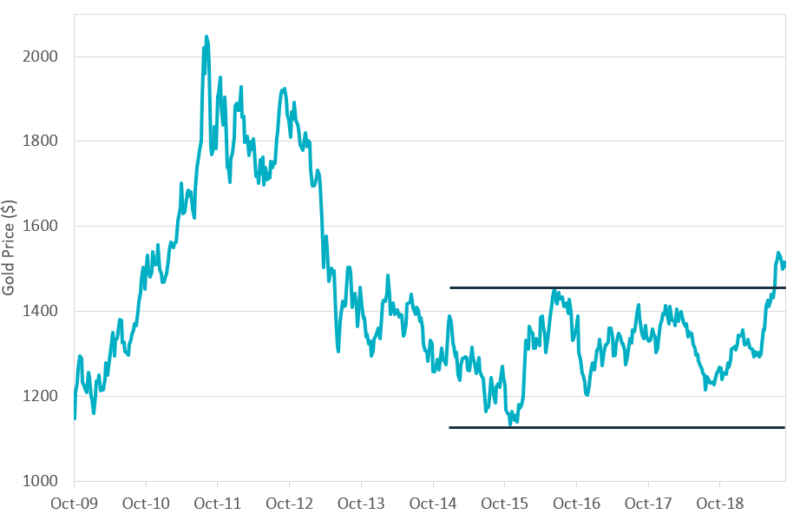
The rise in gold year-to-date to September 2019 (up +14.4%) has not been as strong as palladium in absolute terms, but it has a similar pattern in that it resulted in a breach of a multi-year range between approx. $1,130 and $1,450. The sharp decline in global bond yields, uncertainty over the US and China’s trade war and dovish policy action by global central banks, have been key drivers of the rally since May 2019.
Notably gold accelerated higher after the ECB heavily hinted in June 2019 that it may restart quantitative easing. The shift in the macroeconomic backdrop appears to have prompted an asset allocation shift from investors as, so far in 2019, we have seen strong inflows into gold ETFs, and evidence of greater demand for gold from central banks as a reserve holding.
Chart 2. Gold price over 10 years, front month futures contract: Oct-2009 to Sep-2019
<
Source: Abbey Capital & Bloomberg. Past results are not indicative of future returns.
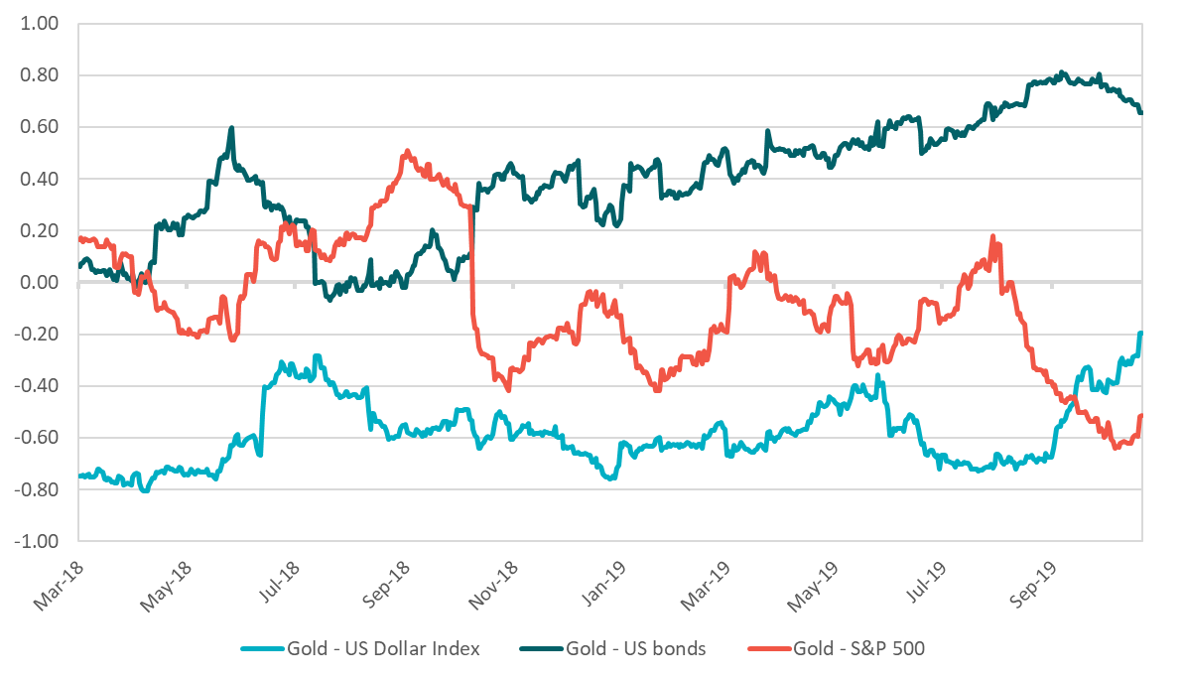
Historically gold has been negatively correlated to the USD and the S&P 500 Index and positively correlated to US Treasuries. In recent months, the correlation between gold and the US Dollar Index has become less negative, while the negative correlation with equities and the positive correlation with bonds have increased, suggesting that gold’s safe haven status may have been the primary driver of it’s price in recent months.
Chart 3. 60-day gold correlations with the S&P 500, US Dollar Index and US bonds: Mar-2018 to Oct-2019
Source: Abbey Capital & Bloomberg. Please note that US bonds are represented by the JP Morgan US Government Bond Index.
See the “Index Definitions” section at the end of this piece for a description of all indices used. Past results are not indicative of future returns.
Although silver is also up in 2019, it has lagged the moves in gold and palladium. Silver was still negative year-to-date as of the end of June 2019 possibly reflecting the different fundamental drivers of silver versus gold. While gold is mostly considered a store of value, silver’s main use is for industrial purposes.
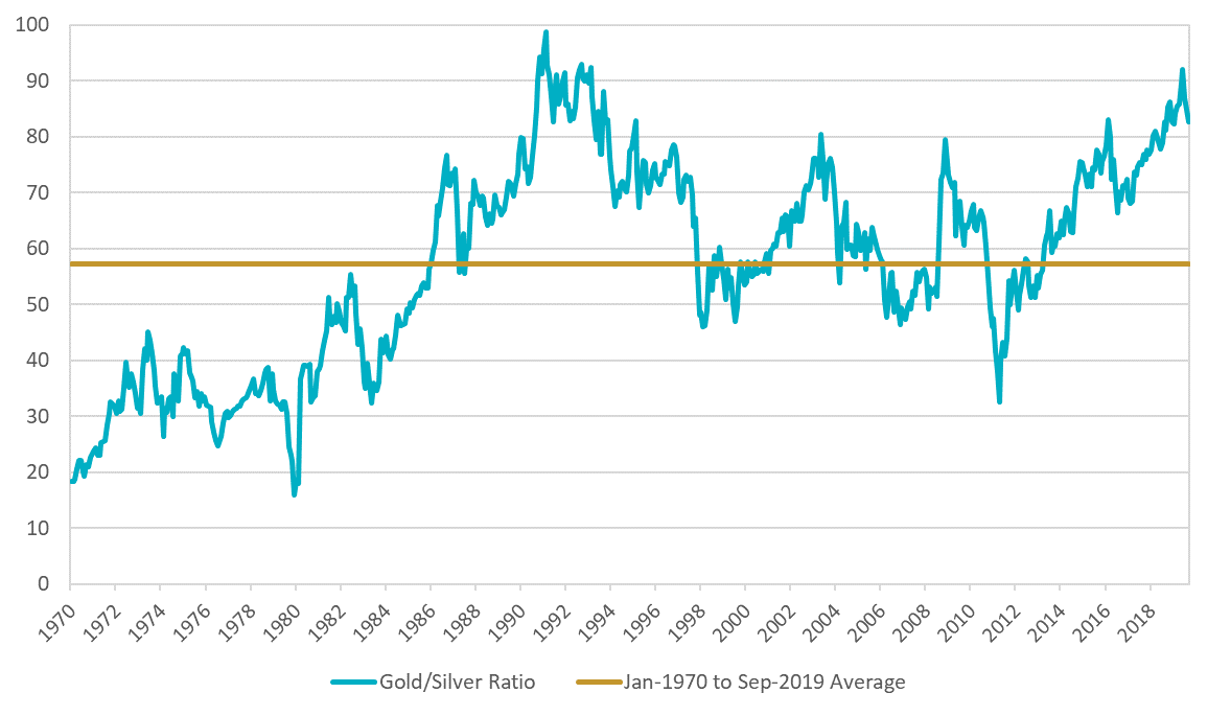
However, the strong rise in gold in June appears to have influenced sentiment in the silver market triggering a catch up move in silver during July and August. That rally in gold resulted in a widening of the gold/silver ratio to its highest level since the early 1990s which appears to have attracted value buyers to silver. As the graph below shows, this ratio has begun to narrow somewhat in recent months.
Chart 4. Gold/silver ratio: Jan-1970 to Sep-2019
Source: Abbey Capital & Bloomberg. Past results are not indicative of future returns.
However, the lagged move in silver in 2019 has not been as attractive from a Trendfollowing perspective as the move in gold.
In the early part of the year silver chopped around in a range whereas gold has trended more consistently particularly since May (although gold and silver have both experienced counter trend moves in the last two months).
This is reflected in Abbey Capital’s proprietary market indicators. Whereas gold has trended approximately 48% of the time in the last 260 trading days, silver has been in a trend only 37% of the time*. Past results are not indicative of future returns.
*Note on percentage of time trending indicator
The analysis categorises each market as either (i) Trending, (ii) Consolidating/Reversing or (iii) No Trend using 20-day and 120-day moving average crossover analysis. We then calculate the percentage of time the market has been in a trending phase over the last 260 trading days. If the 20-day moving average is between the price and the 120-day moving average, the market is Trending. Otherwise the market is consolidating/reversing or not in a trend. Past results are not indicative of future returns.
**Note on backwardation
Backwardation is the term given to a commodity futures market when the current spot price of a commodity is higher than the futures price.
Index Definitions
S&P 500 Index: The S&P 500 Index is an index of 500 US stocks chosen for market size, liquidity and industry grouping, among other factors. The S&P 500 is designed to be a leading indicator of U.S. equities and is meant to reflect the risk/return characteristics of the large cap universe.
JP Morgan US Government Bond Index: The JP Morgan US Government Index is a leading measure of US government bond market performance. The Index measures the total return of US Treasury securities across the whole yield curve
US Dollar Index: The US Dollar index, which was introduced in 1973, measures the value of the US Dollar relative to a basket of developed-market foreign currencies. The foreign currencies included in the index are as follows: Euro, Japanese Yen, British Pound, Canadian Dollar, Swedish Krona and the Swiss Franc.
Important Information, Risk Factors & Disclosures
This piece is for the purpose of providing general information and does not purport to be full or complete or to constitute advice.
Abbey Capital is a private company limited by shares incorporated in Ireland (registration number 327102). Abbey Capital is authorised and regulated by the Central Bank of Ireland as an Alternative Investment Fund Manager under Regulation 9 of the European Union (Alternative Investment Fund Managers) Regulations 2013 (“AIFMD”). Abbey Capital is registered as a Commodity Pool Operator and Commodity Trading Advisor with the U.S. Commodity Futures Trading Commission (“CFTC”) and is a member of the U.S. National Futures Association (“NFA”). Abbey Capital is also registered as an Investment Advisor with the Securities Exchange Commission (“SEC”) in the United States of America. Abbey Capital (US) LLC is a wholly owned subsidiary of Abbey Capital. None of the regulators listed herein endorse, indemnify or guarantee the member’s business practices, selling methods, the class or type of securities offered, or any specific security.
While Abbey Capital has taken reasonable care to ensure that the sources of information herein are reliable, Abbey Capital does not guarantee the accuracy or completeness of such data (and same may not be independently verified or audited) and accepts no liability for any inaccuracy or omission. Opinions, estimates, projections and information are current as on the date indicated on this piece and are subject to change without notice. Abbey Capital undertakes no obligation to update such information as of a more recent date.
Pursuant to an exemption from the CFTC in connection with accounts of qualified eligible persons, this report is not required to be, and has not been, filed with the CFTC. The CFTC, the SEC, the Central Bank of Ireland or any other regulator have not passed upon the merits of participating in any trading programs or funds promoted by Abbey Capital, nor have they reviewed or passed on the adequacy or accuracy of this report.
Risk Factors: This brief statement cannot disclose all of the risks and other factors necessary to evaluate a participation in a fund managed by Abbey Capital. It does not take into account the investment objectives, financial position or particular needs of any particular investor. Trading in futures is not suitable for all investors given its speculative nature and the high level of risk involved. Prospective investors should take appropriate investment advice and inform themselves as to applicable legal requirements, exchange control regulations and taxes in the countries of their citizenship, residence or domicile. Investors must make their own investment decision, having reviewed the private placement memorandum carefully and consider whether trading is appropriate for them in light of their experience, specific investment objectives and financial position, and using such independent advisors as they believe necessary. The attention of prospective investors in the fund is drawn to the potential risks set out in the private placement memorandum of the fund under the heading ‘Risk Factors’.
Where an investment is denominated in a currency other than the investor’s currency, changes in the rates of exchange may have an adverse effect on the value, price of, or income derived from the investment. Past performance is not a guide to future performance. Income from investments may fluctuate. The price or value of the investments to which this report relates, either directly or indirectly, may fall or rise against the interest of investors and can result in a total loss of initial investment. Certain assumptions may have been made in this analysis, that have resulted in the returns detailed herein. No representation is made that any returns indicated herein will actually be achieved.
Potential investors are urged to consult with their own professional advisors with respect to legal, financial and taxation consequences of any specific investments they are considering in Abbey Capital products.
The information herein is not intended to and shall not in any way constitute an invitation to invest in any of the funds managed by Abbey Capital. Any offer, solicitation or subscription for interests in any of the funds managed by Abbey Capital shall only be made in a private offering to qualified investors pursuant to the terms of the relevant private placement memorandum and subscription agreement and no reliance shall be placed on the information contained herein.
This piece and all of the information contained in it is proprietary information of Abbey Capital and intended solely for the use of the individual or entity to whom it is addressed or those who have accessed it on the Abbey Capital website. Under no circumstances may it be reproduced or disseminated in whole or in part without the prior written permission of Abbey Capital.


