


Managed Futures: Alternative Risk Premia
Introduction
In recent years there has been a huge increase of investment offerings in categorizations such as smart beta, alternative beta, style premia and alternative risk premia. Investors are increasingly assessing what is the value of these strategies versus traditional hedge fund offerings.
This note gives a brief overview of these alternative strategies, examines similarities and differences between managed futures and alternative risk premia strategies, and outlines some of the key issues investors should consider when choosing between these strategies.
 The Evolution of Alpha and Beta
The concepts of alpha and beta have their origins in the Capital Asset Pricing Model (“CAPM”), which was developed in the 1960s. The CAPM encapsulated the idea that equities had an element of diversifiable risk and an element of non-diversifiable risk. The non-diversifiable risk was the market risk or beta. If an investor held the market portfolio, they were capturing the market beta. Equally, if an investor actively managed a portfolio and generated a return in excess of that predicted by that portfolio’s beta, there was an element of skill, known as alpha or excess risk-adjusted return.
This produced a clear demarcation between alpha and beta in the investment industry. Passive, long-only, index funds aimed to capture the market beta (i.e. 100% market beta), actively managed long-only funds were a combination of market beta and alpha, while alternative investments such as hedge funds were 100% alpha. Hedge funds were seen as producing alpha, as returns were generated by gaining exposure to risk factors other than market risk or beta.
Chart 1 Traditional investment categorization?
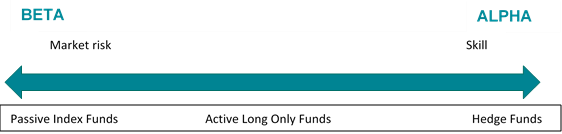
Source: Abbey Capital. Used for illustrative purposes, only.
A second important development in finance theory was the introduction of the three-factor model by Fama and French in 1992 which identified three factors to explain equity market returns (the market, value and size), in contrast to the original CAPM, which only used the market factor.
This framework helped investors assess if a portfolio’s returns were being driven by manager skill or by having a tilt towards well-established factors such as value or size. This development spawned the growth of smart beta strategies, which were typically long-only equity strategies, seeking to exploit these known risk factors.
Over time, as knowledge of hedge fund strategies has improved, similar analysis has been applied to hedge funds. Strategies such as carry, value or momentum have increasingly been seen as capturing the return from a known risk or style premium[1] rather than alpha. The common factors amongst each of these strategies is that they are now well known, have been successful over the long-term and can be systematized. Typically, fees are lower on these strategies and performance fees are not charged.
Chart 2 Revised investment categorizations

Source: Abbey Capital
Where Do Managed Futures Strategies Fit in this Framework?
Managed futures strategies, alternative risk premia and style premia strategies share the commonality of being part of the broad array of liquid diversifying strategies available to investors. These strategies aim to provide diversification for investors whose portfolios are primarily exposed to traditional assets like equities and bonds.
Diversifying strategies generate returns which tend (to differing degrees) to be uncorrelated to equities over the long-term (see Table 1), as the drivers of returns of these strategies tend to be fundamentally different to a traditional long equity or fixed income exposure.
Table 1 Correlation of the SG Trend Index, SG CTA Index, SG Short Term Traders Index, SG Multi Alternative Risk Premia Index
(“SG MARP Index”) and the S&P Total Return Index: Jan 2018 – Aug 2019
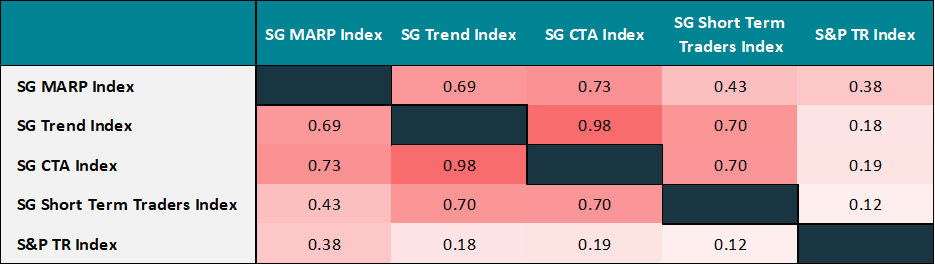
Source: Société Générale, Bloomberg & Abbey Capital. Data is shown from January 2018 as this is the inception of the SG MARP Index.
The common aspect amongst managers in the managed futures industry is that they use bi-directional strategies trading multiple futures and FX markets. The trading strategies used vary from manager to manager, however Trendfollowing is the most widely used strategy, while Short-term, Discretionary Macro and Systematic Macro are other common strategies.
There is some overlap between the strategies employed in managed futures and alternative risk premia strategies as variants of carry, value and momentum are employed by many commodity trading advisors (“CTA”). In effect CTAs seek to profit from some of these known risk premia, while also seeking to differentiate themselves in their implementation and use of unique strategies.
The challenge for investors is in determining which of these strategies are more likely to deliver uncorrelated returns and alpha going forward.
Evaluating Alternative Risk Premia versus Managed Futures Strategies
For investors assessing the merits of managed futures versus alternative risk premia offerings there are a number of points to consider.
Strategy Characteristics
First, although both sets of strategies are uncorrelated with equities, the return profile of managed futures tends to be quite different from alternative risk premia. Alternative risk premia funds are typically market neutral, rather than directional, and hold long and short positions within bonds, equities and commodities without taking large directional exposures at the asset class level. This means that they can generate a low correlation to equities, however, they are unlikely to capitalize on strong directional moves at the asset class level should these arise.
In contrast, the most dominant trading strategy in the managed futures industry is directional Trendfollowing applied across multiple asset classes. We believe these strategies have greater potential than risk premia to capitalize on significant trends in markets, should they arise. Indeed, historically some of the best periods for managed futures have been when strong multi-month trends have arisen in markets. Some researchers have found alternative risk premia strategies only explained a small component of CTA returns, highlighting the different nature of the return drivers.[2]
Chart 3 Performance of SG Trend Index versus SG Alternative Risk Premia Index: January 2016 – August 2019
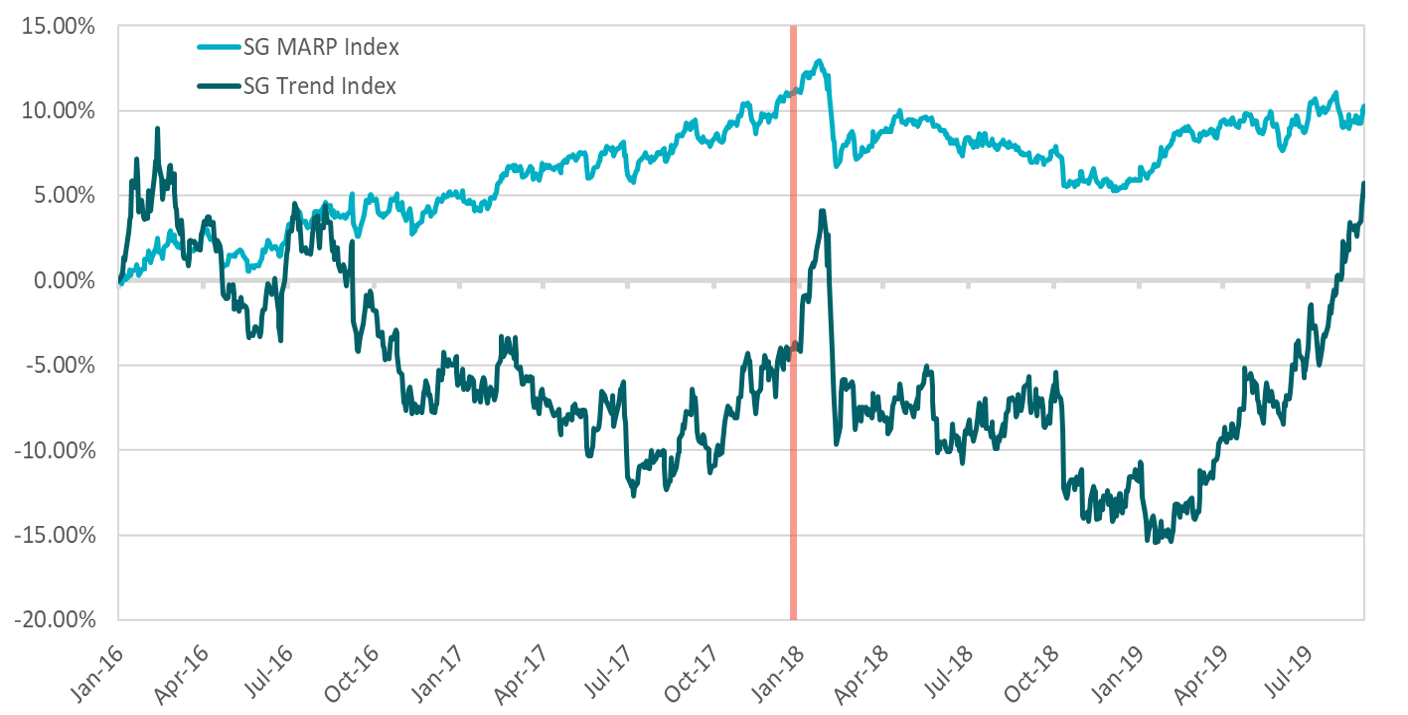
Source: Abbey Capital, Bloomberg & Société Générale. Note that the SG MARP Index was launched in January 2018, however Société Générale have backfilled the index to January 2016 using live returns data and annual walk-forward manager re-selection process. Hypothetical back-tested index performance information shown in the graph is provided for informational purposes only and should not be considered investment advice or a recommendation to buy or sell any types of securities. Back-tested performance is NOT an indicator of future actual results. Back-tested performance is developed with the benefit of hindsight and has inherent limitations. Specifically, back-tested results do not reflect actual trading or the effect of material economic and market factors on the decision-making process. Back-tested results are calculated by the retroactive application of a model constructed on the basis of historical data and based on assumptions integral to the model which may or may not be testable and are subject to losses. Past results are not indicative of future returns.
Comparing SG MARP Index performance versus the SG Trend Index since 2016 in Chart 3 we can get a sense of the different return profiles (we have highlighted the index inception date to differentiate the backfilled period from the live data starting in January 2018). The SG MARP Index outperformed from mid-2016 to mid-2017 in what was a period characterized by declining volatility and few sustained trends in markets. In contrast the SG Trend Index has outperformed in 2019, particularly since Q2, given the backdrop of strong trends in fixed income markets.
Historically, some of the best periods for the SG Trend Index were periods when equities sold off strongly (such as in 2001-2002 and 2008) as these periods were characterized by large directional moves in markets. Performance data on the SG MARP data is not available for these periods, however since these strategies are considered to be market neutral they may not perform as strongly as directional strategies such as Trendfollowing should markets experience large dislocations and directional moves.
Skill in implementation
Second, although certain managed futures strategies may fall into the same category as alternative risk premia strategies, there may be substantial differences in the skill of implementation and execution. For example, the SG Trend Indicator, which applies a simple 20-120 day moving average strategy to 55 futures markets, is an example of a vanilla trendfollowing strategy. Many Trendfollowing managers employ much more sophisticated techniques to generate trading signals, determine risk allocations, size positions and execute trades.
Chart 4 shows the performance of the SG Trend Index (the “Index”), an index of leading Trendfollowing managers’ performance, versus the SG Trend Indicator (the “Indicator”) since 2000. The Indicator was launched by Société Générale in 2010 to attempt to proxy the performance of large Trendfollowing managers and data was backfilled to 2000.
The chart demonstrates (1) the value of sophisticated Trendfollowing managers versus a simple Trendfollowing rule i.e. the Index has outperformed the Indicator over the full period and (2) the challenge of trying to replicate Trendfollower performance using simple strategies such as the 20-120 day moving average crossover. Although the correlation of the Indicator to the Index after August 2010 is almost exactly the same as in the backfilled period, performance of the Indicator has typically lagged the Index in the “live” period since August 2010.
Chart 4 Performance of SG Trend Index versus SG Trend Indicator: January 2000 – August 2019
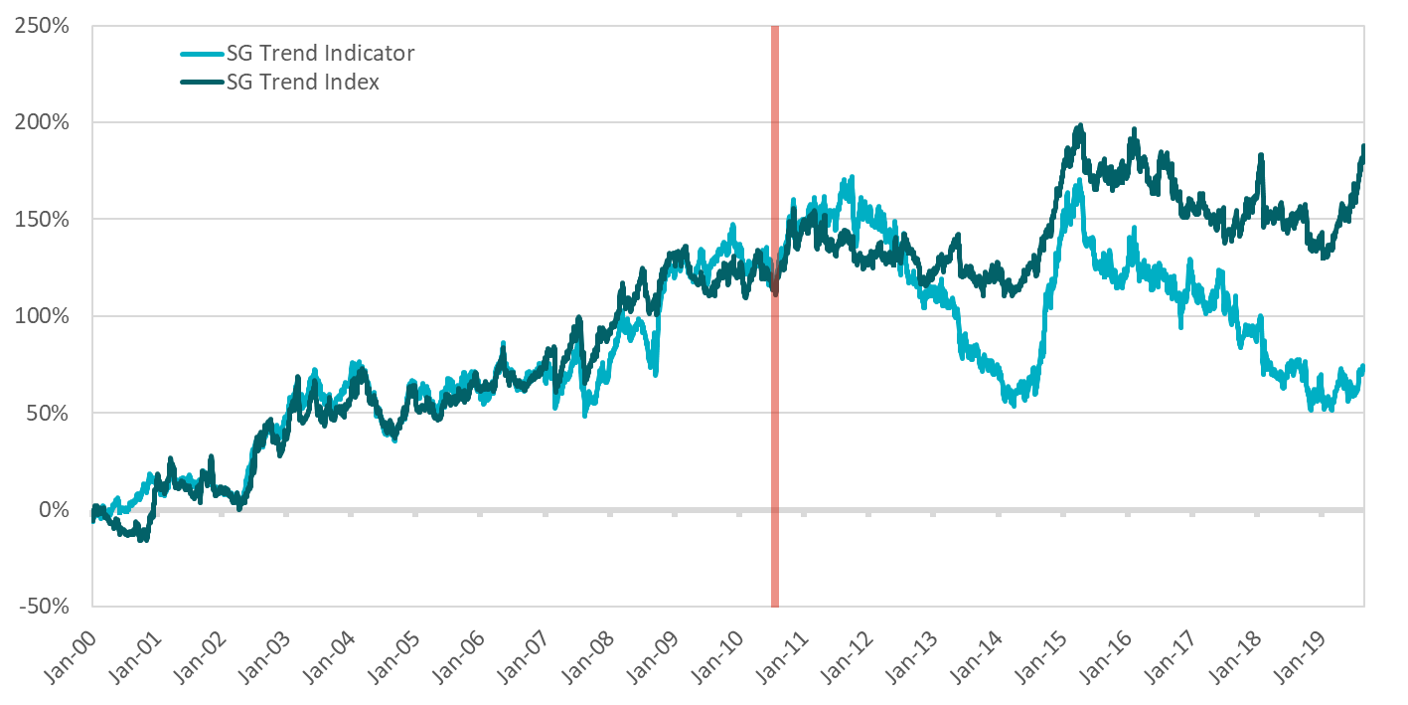
Source: Abbey Capital, Bloomberg & Société Générale. Please see the end for description of indices. Hypothetical back-tested index performance information shown in the graph is provided for informational purposes only and should not be considered investment advice or a recommendation to buy or sell any types of securities. Back-tested performance is NOT an indicator of future actual results. Back-tested performance is developed with the benefit of hindsight and has inherent limitations. Specifically, back-tested results do not reflect actual trading or the effect of material economic and market factors on the decision-making process. Back-tested results are calculated by the retroactive application of a model constructed on the basis of historical data and based on assumptions integral to the model which may or may not be testable and are subject to losses. Past results are not indicative of future returns.
Integrity of research process
The above analysis highlights a general point about the assessment of two investment programs: an investor should not just rely on performance data to determine the difference in quality between two investment managers or programs. As returns are subject to randomness, it requires many years for an investor to be able to confidently determine that, over the long-term, program A is superior to program B.
For example, in August 2010, if an investor was considering investing in a simple Trendfollowing strategy (such as the Indicator) or a portfolio of more sophisticated Trendfollowers (as is represented by the Index), an investor may be tempted to go for the vanilla strategy if the fees were notably less. However, since August 2010 the Index has outperformed substantially.
More generally, as alternative risk premia investing has become more popular, more and more potential risk factors or premia have been identified. While the original Fama-French framework has now been extended to five well-established factors, one paper has identified over 300 potential risk premia[3]. As many risk premia are explained by possible behavioural characteristics of investors, there is a risk that strategies have been overfit to historical data with a behavioural explanation subsequently provided to explain the apparent anomaly or source of outperformance.
The question for investors is whether these risk premia will be as evident in the future as in the past. Indeed, one study found a 73% median deterioration in Sharpe ratios between back tested and live performance periods for alternative beta strategies[4]. Skilled quantitative investment managers are acutely aware of the dangers of overfitting and actively manage their research processes to ensure researchers don’t fall foul of such tendencies. In assessing the potential alpha from a CTA versus an alternative risk premia strategy, investors need to assess the quality of the investment personnel and the research process underpinning the investment program.
Access to unique strategies and markets
There are also several strategies used in the managed futures industry which fall outside alternative risk premia. Short-term managers, who employ a diverse mix of momentum, mean reversion and breakout strategies are fundamentally different to alternative risk premia. Short-term managers have historically performed better in periods of rising volatility and have tended to underperform in periods of contracting volatility.
Discretionary Macro managers generally trade based on their assessment of global macroeconomic and market conditions, fundamentally different inputs to those used in alternative risk premia. Of course, Global Macro managers have the ability to exploit carry, value or momentum opportunities at any given instance, but these managers tend to be more selective in their trading with exposure driven by a small number of macro themes.
Systematic Macro managers do share some similarity with alternative risk premia strategies, but again many managers have idiosyncratic strategies around market events, flows and exploiting lead-lag relationships which are not evident in style premia strategies.
More sophisticated Trendfollowing programs are increasingly providing investors with exposure to a broader array of markets by diversifying into smaller commodity markets and other markets such as OTC swaps, which provide diversification versus more vanilla Trendfollowing strategies such as the SG Trend Indicator we discussed earlier. In contrast, alternative risk premia strategies are designed to have large capacity and consequently trade the most liquid futures and FX markets.
Conclusion
The growth of alternative risk premia and style premia funds offers more choice to investors and an alternative to traditional hedge funds. Like hedge funds and managed futures, these offerings provide the potential to access uncorrelated sources of return and the potential for diversification of equity risk.
While there are some similarities between managed futures strategies and those categorized under alternative risk premia there are also notable differences. In particular, given the directional nature of Trendfollowing, historically some of its best periods of performance have been when markets have experienced dislocations and large directional moves.
When assessing the merit, and potential alpha, of these strategies within a diversified portfolio, the key for investors is to not only assess the historic track record but also the characteristics of the strategies in different market environments, and the cost versus the quality of the research process underpinning the investment offering.
Footnotes:
[1] There are many forms of risk premia in the financial markets. The most common is the equity risk premium. This is the return from holding equities (as measured by the marked cap weighted index) in excess of the risk-free rate. More generally, risk premia are the returns for assuming different types of risk; there is a risk premium for taking the risk of investing in a long-term bond versus a short-term bond which is called the term premium. A style premium is the return from investing according to a known style or factor.
[2] See Foran J et al (2017) “Just a One-Trick Pony? An Analysis of CTA Risk and Return”. The Journal of Alternative Investments
[3] Harvey et al (2016) “…and the Cross-Section of Expected Returns”. The Review of Financial Studies
[4] Suhonen, A., Lennkh, M., & Perez, F. (2017). Quantifying backtest overfitting in alternative beta strategies. The Journal of Portfolio Management
Indices
S&P 500 Index Total Return Index (“S&P 500 TR Index”)
The S&P 500 Index is an index of 500 US stocks chosen for market size, liquidity and industry grouping, among other factors. The S&P 500 Total Return Index is the total return version of the S&P 500 Index. Dividends are reinvested on a daily basis and all regular cash dividends are assumed reinvested in the index on the ex-date.
SG CTA Index
The SG CTA Index is a daily performance benchmark of major CTAs; it calculates the daily rate of return for a pool of CTAs selected from the larger managers that are open to new investment. Selection of the pool of qualified CTAs used in construction of the index is conducted annually.
SG Trend Index
The SG Trend Index is designed to track the 10 largest trend following CTAs (by AUM) and be representative of the trend followers in the managed futures space. The index is equally weighted and rebalanced annually on the 1st of January.
Barclay CTA Index
The Barclay CTA Index is a leading industry benchmark of representative performance of commodity trading advisors. There are currently 510 programs included in the calculation of the Barclay CTA Index. The index is equally weighted and rebalanced at the beginning of each year.
SG Multi Alternative Risk Premia Index (“SG MARP Index”)
The SG Multi Alternative Risk Premia Index represents risk premia managers who employ investment programs diversified across multiple asset classes while utilizing multiple risk premia factors. These managers trade multiple asset classes such as equities, fixed income, currencies, and in many cases commodities, and aim to capture a diversity of discrete risk premia, including most prevalently value, carry, and momentum.
Definitions
Correlation
Correlation is a statistical measure which quantifies the extent to which two assets, or securities, move in relation to each other. The correlation coefficient between two assets can vary from between -1 and +1, with a positive correlation indicating a tendency to rise and fall together, and a negative correlation indicating a tendency to move in opposite directions.
Sharpe ratio
The Sharpe ratio is a measure of risk-adjusted return. The measure subtracts the risk-free rate from the annualised performance of the asset or fund and divides by the realised annualised volatility. A higher (lower) Sharpe ratio is seen as indicative of stronger (weaker) risk-adjusted performance.
Important Information, Risk Factors & Disclosures
This piece contains information provided by or about Abbey Capital Limited (“Abbey Capital”). It is for the purpose of providing general information and does not purport to be full or complete or to constitute advice.
Abbey Capital is a private company limited by shares incorporated in Ireland (registration number 327102). Abbey Capital is authorised and regulated by the Central Bank of Ireland as an Alternative Investment Fund Manager under Regulation 9 of the European Union (Alternative Investment Fund Managers) Regulations 2013 (“AIFMD”). Abbey Capital is registered as a Commodity Pool Operator and Commodity Trading Advisor with the U.S. Commodity Futures Trading Commission (“CFTC”) and is a member of the U.S. National Futures Association (“NFA”). Abbey Capital is also registered as an Investment Advisor with the Securities Exchange Commission (“SEC”) in the United States of America. Abbey Capital (US) LLC is a wholly owned subsidiary of Abbey Capital. None of the regulators listed herein endorse, indemnify or guarantee the member’s business practices, selling methods, the class or type of securities offered, or any specific security.
While Abbey Capital has taken reasonable care to ensure that the sources of information herein are reliable, Abbey Capital does not guarantee the accuracy or completeness of such data (and same may not be independently verified or audited) and accepts no liability for any inaccuracy or omission. Opinions, estimates, projections and information are current as on the date indicated on this piece and are subject to change without notice. Abbey Capital undertakes no obligation to update such information as of a more recent date.
Pursuant to an exemption from the CFTC in connection with accounts of qualified eligible persons, this report is not required to be, and has not been, filed with the CFTC. The CFTC, the SEC, the Central Bank of Ireland or any other regulator have not passed upon the merits of participating in any trading programs or funds promoted by Abbey Capital, nor have they reviewed or passed on the adequacy or accuracy of this report.
Risk Factors: This brief statement cannot disclose all of the risks and other factors necessary to evaluate a participation in a fund managed by Abbey Capital. It does not take into account the investment objectives, financial position or particular needs of any particular investor. Trading in futures is not suitable for all investors given its speculative nature and the high level of risk involved. Prospective investors should take appropriate investment advice and inform themselves as to applicable legal requirements, exchange control regulations and taxes in the countries of their citizenship, residence or domicile. Investors must make their own investment decision, having reviewed the applicable fund offering material carefully and consider whether trading is appropriate for them in light of their experience, specific investment objectives and financial position, and using such independent advisors as they believe necessary. The attention of prospective investors in any fund managed by Abbey Capital is drawn to the potential risks set out in the offering material of that fund under the heading ‘Risk Factors’.
Where an investment is denominated in a currency other than the investor’s currency, changes in the rates of exchange may have an adverse effect on the value, price of, or income derived from the investment. Past performance is not a guide to future performance. Income from investments may fluctuate. The price or value of the investments to which this report relates, either directly or indirectly, may fall or rise against the interest of investors and can result in a total loss of initial investment. Certain assumptions may have been made in this analysis, that have resulted in the returns detailed herein. No representation is made that any returns indicated herein will actually be achieved.
Potential investors are urged to consult with their own professional advisors with respect to legal, financial and taxation consequences of any specific investments they are considering in Abbey Capital products.
The information herein is not intended to and shall not in any way constitute an invitation to invest in any of the funds managed by Abbey Capital. Any offer, solicitation or subscription for interests in any of the funds managed by Abbey Capital shall only be made pursuant to the terms of the relevant offering material, including the subscription agreement and no reliance shall be placed on the information contained herein.
This piece and all of the information contained in it is proprietary information of Abbey Capital and intended solely for the use of the individual or entity to whom it is addressed or those who have accessed it on the Abbey Capital website. Under no circumstances may it be reproduced or disseminated in whole or in part without the prior written permission of Abbey Capital.
